“Code your Own Data Selfie” at Edinburgh Science Festival
Daniel Devine and Craig Steele were joined by creative coder Jen Sykes to run a series of creative coding workshops where young people created self-portraits using their personal data. These hands-on data workshops were part of Edinburgh Science Festival, Europe’s largest science festival.
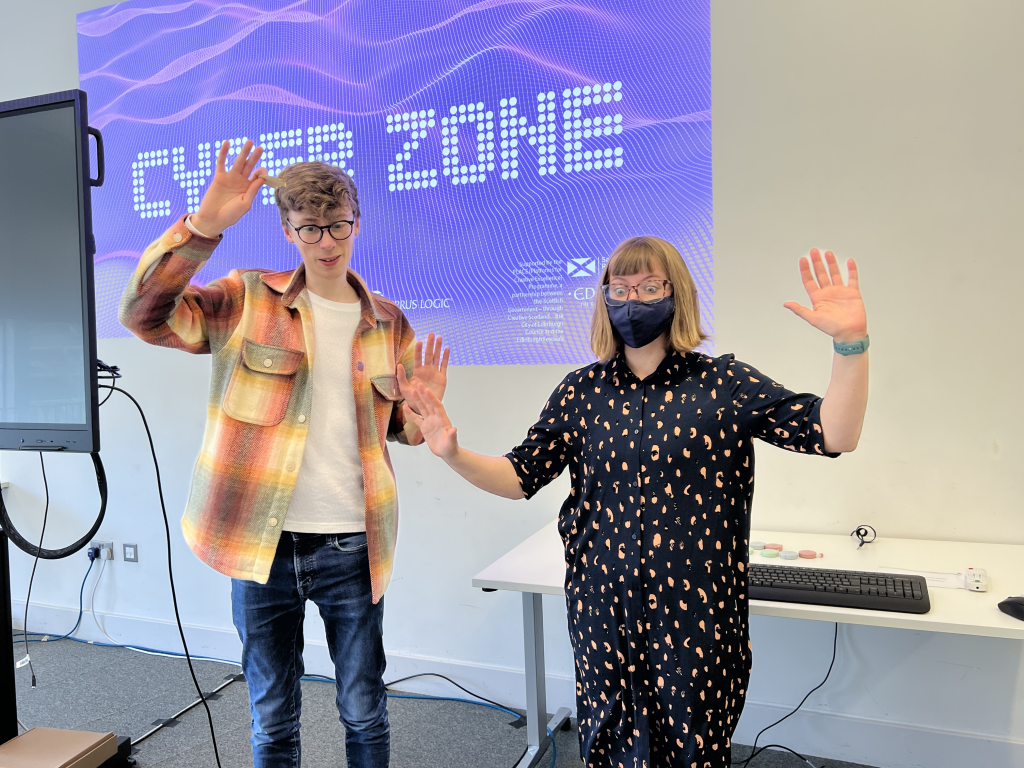
During the school’s spring break, we ran a series of sell-out Code Your Own Data Selfie workshops at Edinburgh Science Festival. Participants got to interact with and turn their personal data into an abstract representation of themselves in the form of a ‘data selfie’.
We (Digital Skills Education) have formed part of the Science Festival’s offering before, running cyber security and data science sessions including the popular online workshop, Defend The Rhino with Data Science.
Edinburgh Science Festival has been a highlight of my year for over 20 years, I loved soldering electronic bagpipes, programming Mars rovers, and watching Dr Bunhead’s pyrotechnic filled demonstrations. It’s great to be a part of the programme, sharing our enthusiasm about data and digital skills with today’s young people.
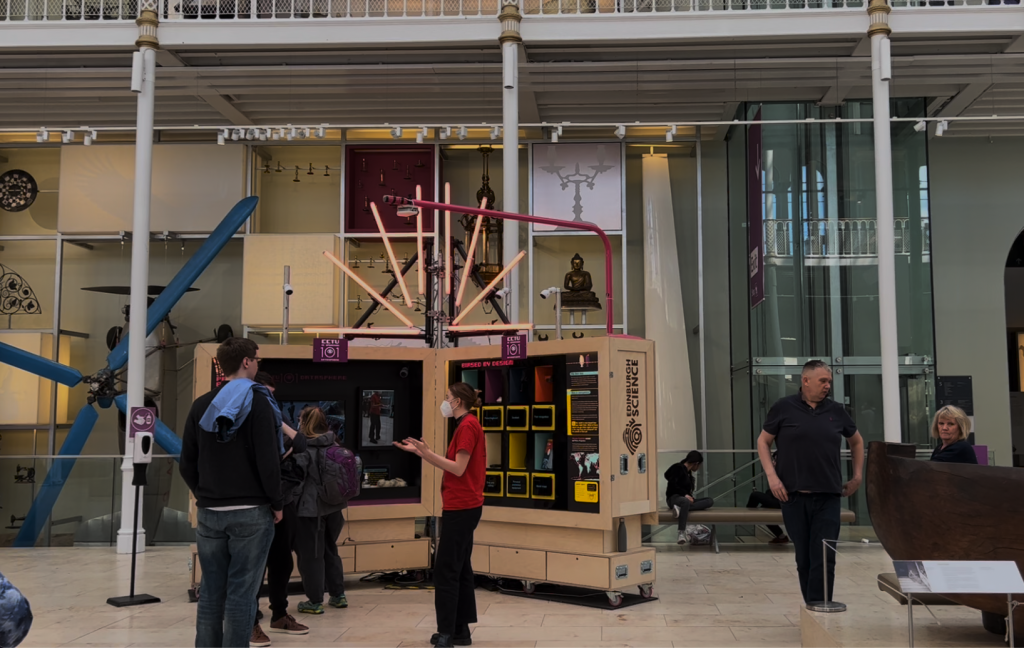
Our workshops were held at the National Museum of Scotland, an iconic venue, home of the DataSphere and CyberZone for the festival. Our home was one the great studios at the back of the museum with a great view over Potterrow and Bristo Square.
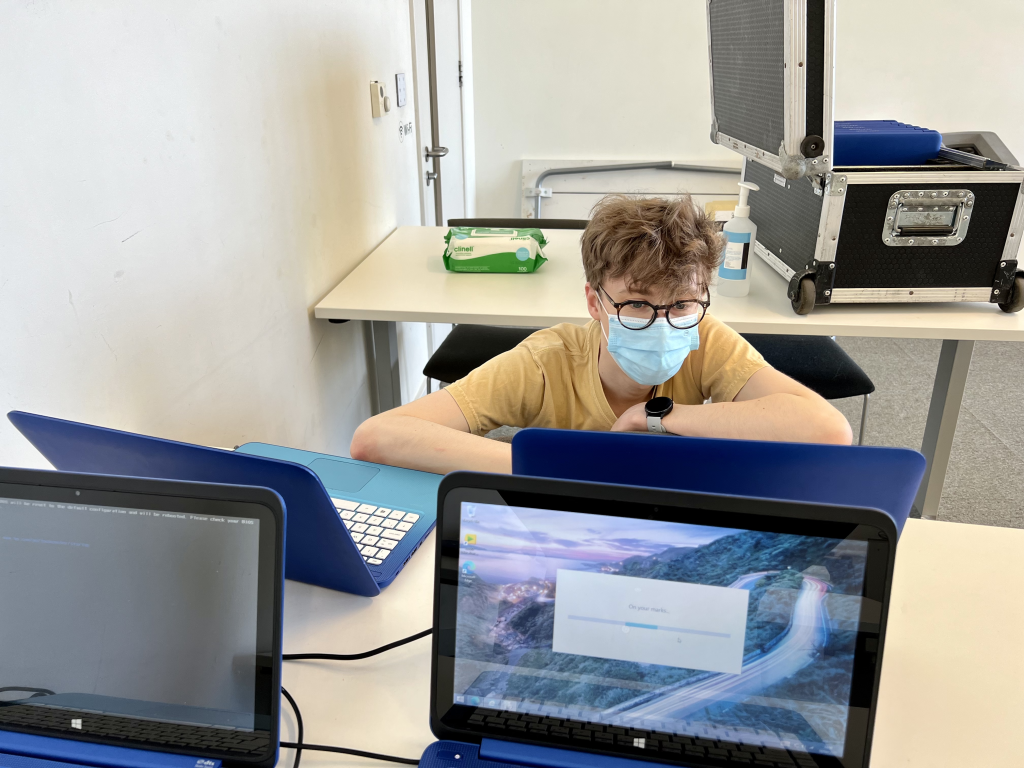
We got into the room a day early to get familiar with the space, set up all of the kit, and tech-test. Matt, the venue manager got us our laptops, copious amounts of hand sanitizer and antibacterial wipes, and some snazzy CyberZone branding.
Our speedy laptops were freshly flight-cased from the Abu Dhabi Science Festival, and needed a few (a lot) of updates. So I got to work updating 16 laptops concurrently, running back and forth. A reprisal of my unofficial job title of Chief Windows Updater.
We only had our learners for an hour, so it was important to think carefully about what we wanted to accomplish within the session. There’s so many demos, stories, and activities we could have completed as part of ‘Create Your Own Data Selfie’. Here’s what we settled on:
Workshop learning outcomes:
- Understand how we can represent ourselves by using data personal to us
- Learn how to use data and code to be creative
- Write code to create an interesting and visually appealing “data selfie”
- Present the final artwork in the digital self portrait gallery
Understand how we can represent ourselves by using data personal to us
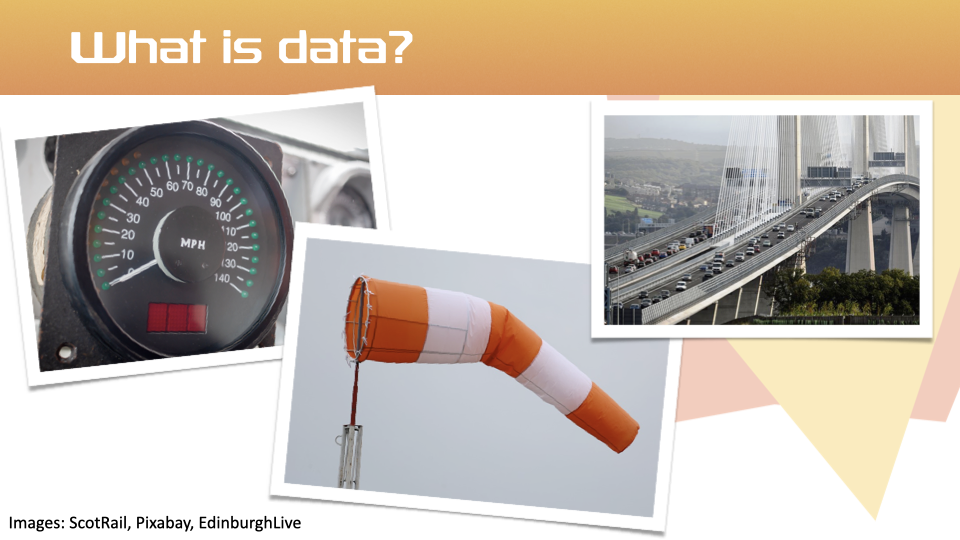
Our participants were as young as 8 years old, before data forms part of the curriculum. So we had to start with the fundamentals, like ‘what is data?’.
We introduced ourselves to the groups by saying our names, and a piece of personal data. Can you guess which fact was me (Daniel), Craig, or Jen?
- My name is ___, I’m a computer scientist, and yesterday I walked 12,567 steps
- My name is ___, I’m a engineer, and I have 386 passwords
- My name is ___, I’m a creative coding artist and I can lift 70kg off the ground and 45kg over my head
The participants then introduced themselves to us, and the group, by telling us their name and a piece of personal data about themselves. We gave them three ideas to make it easier:
- How many bones have you broken?
- How many modes of transport did you take to get here today?
- How far can you swim in metres?
This got them thinking about how much of our day to day lives could be represented by pieces of personal data.
Learn how to use data and code to be creative
Jen, our resident creative coder, brought along some examples of interactive generative art for the participants to get hands-on with.
First, we asked the participants to hum a note and watch the screen. Some orange bars appeared from left to right. We then raised and lowered the pitch together to explore how it reacted. Bars would take a colour based on the pitch recorded. In the end, we drew a rainbow together by gradually raising the pitch to change the colour of the bars. Perhaps the first rainbow drawn by a room of young people humming!

Jen’s second example saw a camera pointed at participants. This time, boxes would start to fall wherever a hand was detected in frame.
The point of these demonstrations was to show how just one or two pieces of data, like the pitch of sound, could form an interesting visualisation.
Write code to create an interesting and visually appealing “data selfie”
Our tool was P5.js, a version of JavaScript with lots of inbuilt libraries to make data visualisation easy. P5.js is great tool to use because it’s aimed at creative people rather than techies. It’s put into a friendly language with lots of common words we already use to describe creative actions, like ‘circle()’ to draw a circle.
The young people created three data selfies:
- A simple visualisation of their age, height, and eye colour
- Something that represents their favourite hobbies and interests
- An abstract portrait containing over 20 metrics about them
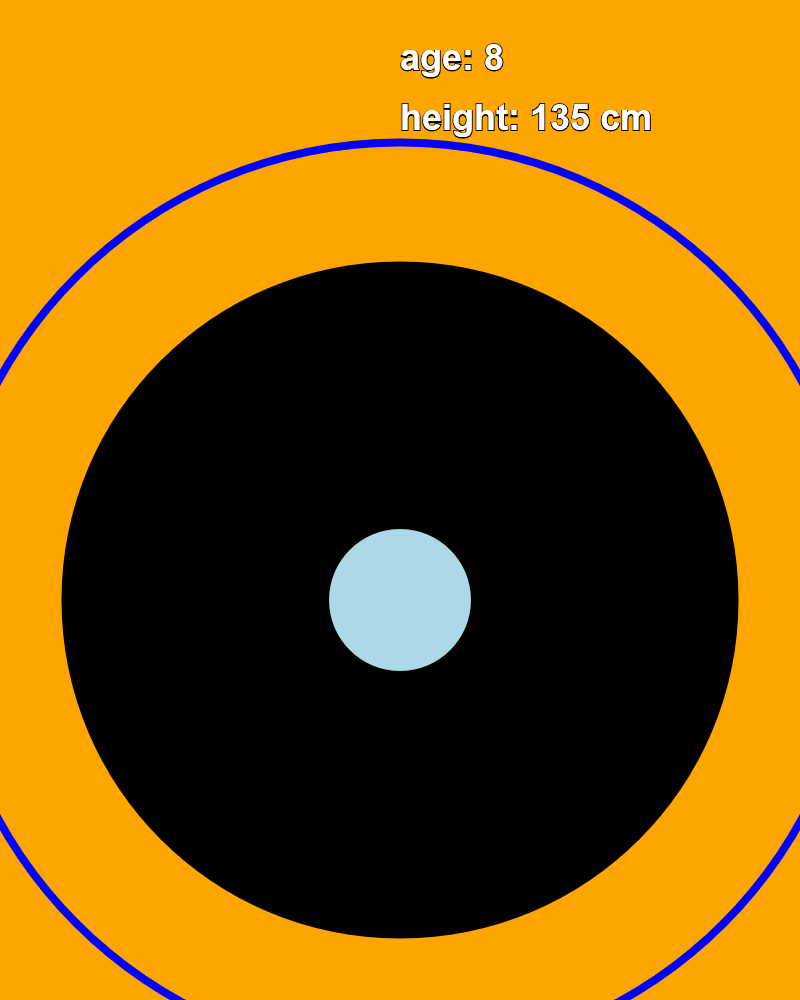
Our first selfie introduced the basics of P5.js. From this selfie, I can tell you the creator has blue eyes, black socks, likes orange, and is shorter than Harry Styles (blue outer rim).
Participants had to edit the code, to add their data. We brought along measuring tapes to make sure the height measurement was as accurate and up to date as possible. It’s always worth including moments in a computing workshop that doesn’t involve using the computer!
Once their selfies were done, as an extension, participants added in extra code to draw a circle representing Harry Styles’s height. This contextualised the scale of the outer circle which is proportional to the participants’s height. By looking at their circle versus the new one they were able to compare their height to Harry’s. Nobody in any of our workshops was taller!
Second selfie
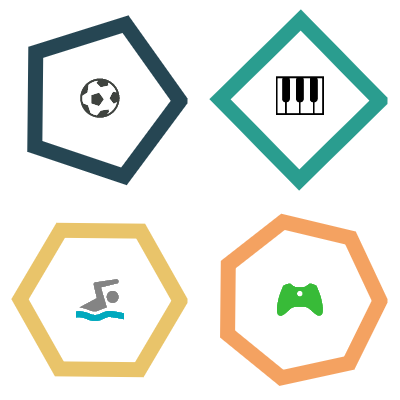
Our second selfie saw us make data selfies that visualise hobbies and interests.
In this sketch, an emoji is used to describe each hobby and interest. The number of sides on the shape tells us how much you enjoy the hobby, the more sides the more you enjoy it!
From this selfie, I can see Jackson’s favourite hobby is gaming, followed by swimming, football, and piano.
Final selfie
Our final selfie built on the skills learned so far, adding in more data, more emojis, more shapes, and more colours.
Reading this selfie, I can tell the following about Jamie:

- Favourite hobby is gaming
- Favourite time of day is night
- Favourite animal is a chicken
- Is an introvert
- Was born in Autumn
- Has one younger sibling
- Can hold their breath for about 50 seconds
- Is a vivid dreamer
- Has a name with 5 letters
You might need to try the activity yourself in order to decode these!
Every selfie created during the workshop is live on our digital portrait gallery. Our system allows anyone who creates a selfie to submit it to us for exhibition.
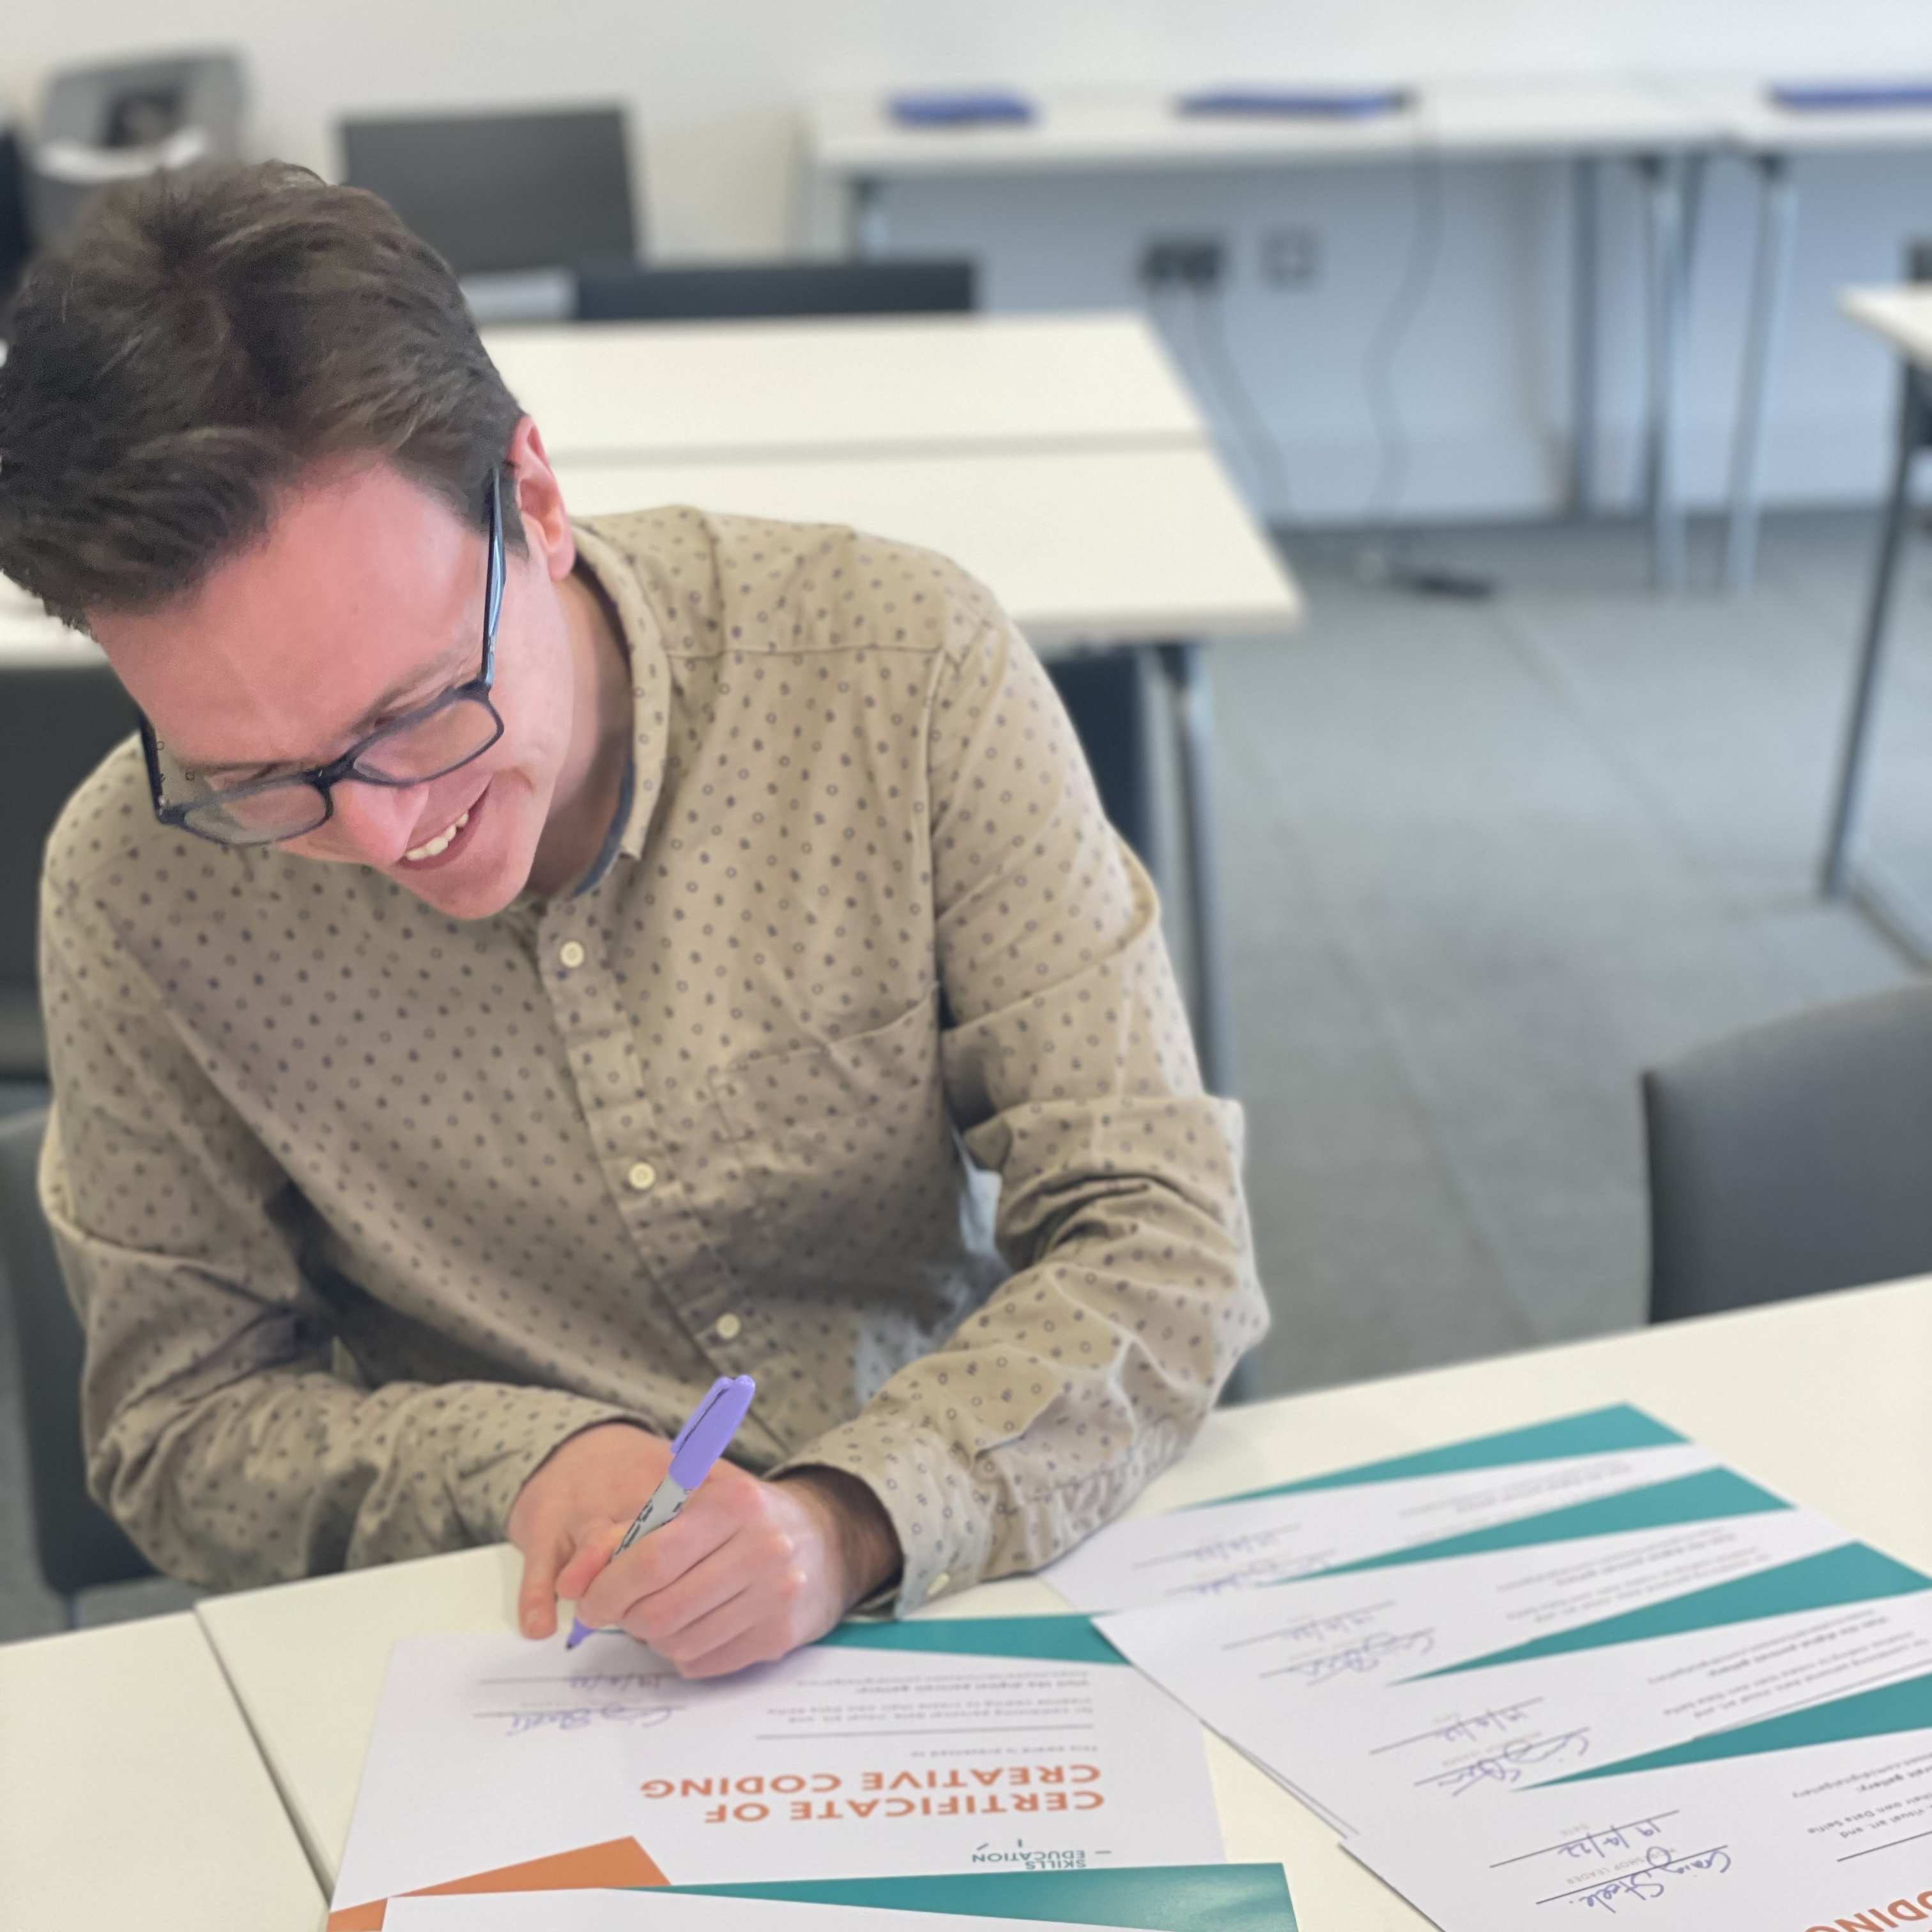
Participants got a certificate celebrating their achievements, in only an hour we:
- Introduced personal data
- Shared and collected data about ourselves
- Got started programming in JavaScript
- Created 3 personalised data selfies, developing our skills
- Shared and celebrated our artwork by exhibiting it in an online gallery
You can view the selfies, or create your own, by visiting our digital portrait gallery on our website.
Want us to run “Code Your Own Data Selfie” at your science festival, technology conference, or educational event?
Email Daniel on daniel@digitalskillseducation.com